#30DayMapChallenge Day 2. Lines
Autumn 🍂
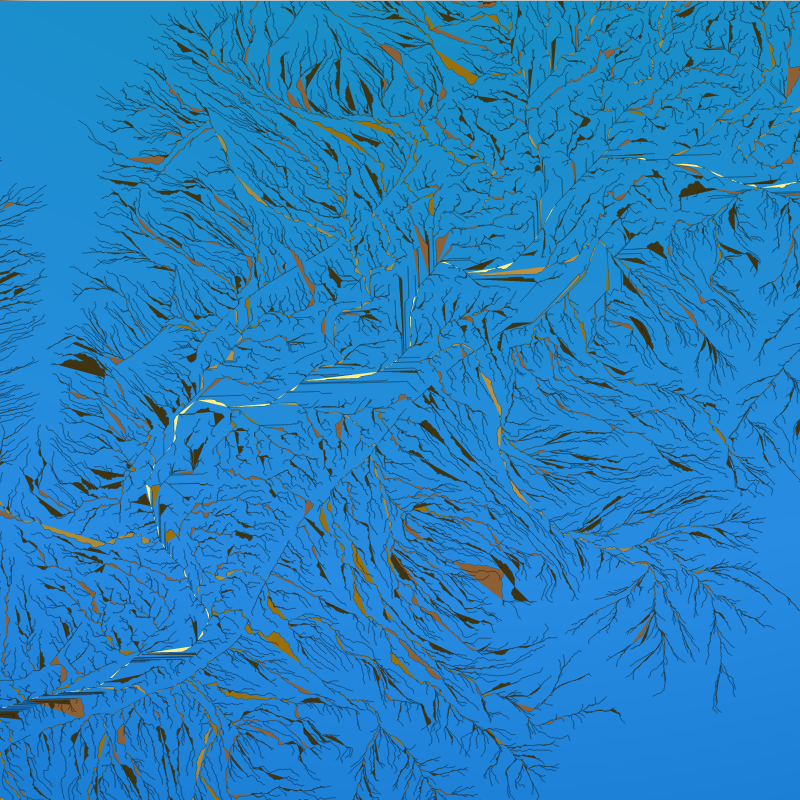
The visualization below shows the Yosemite Valley river network and catchment area.
Streams are coloured by their flow order.
Data:
OpenTopography
Graphic: @maptheclouds